

2015
2015
2015
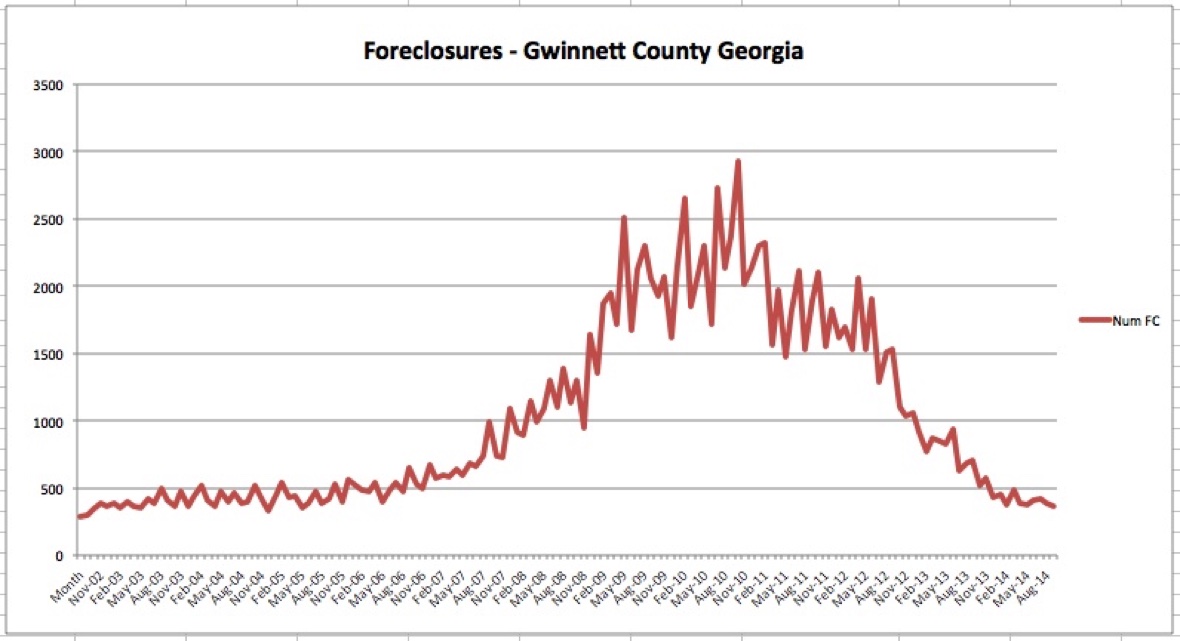
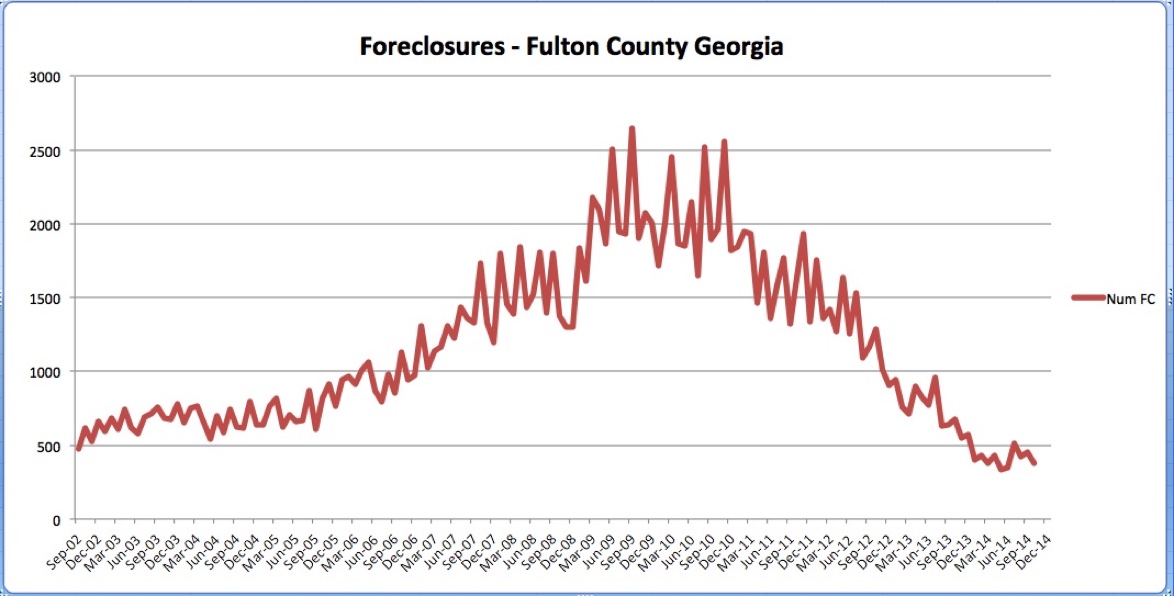
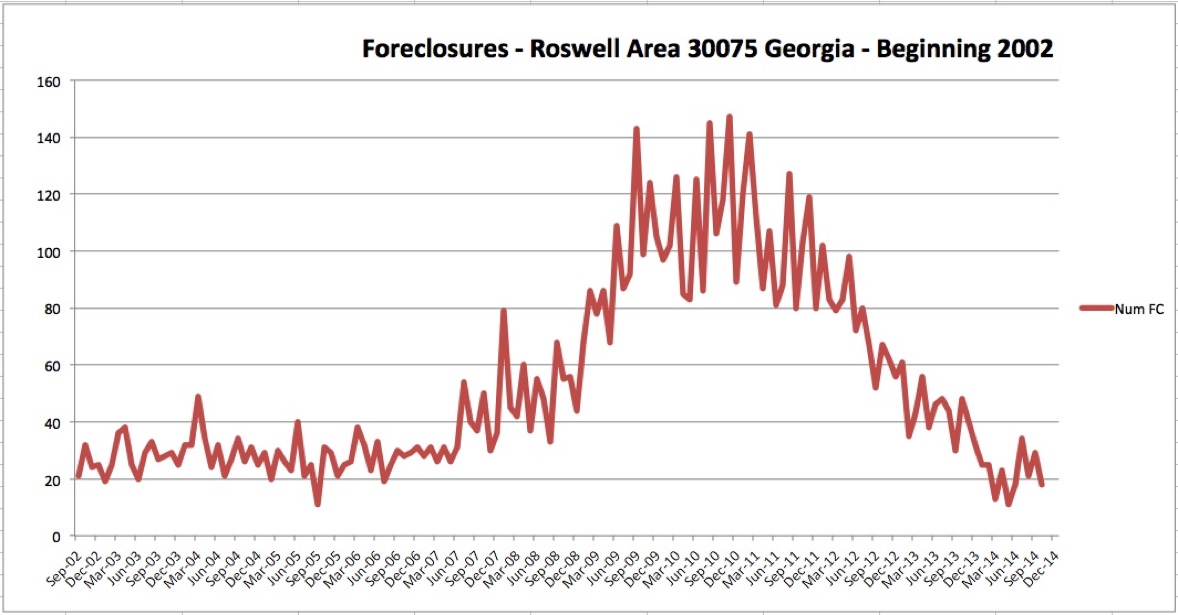
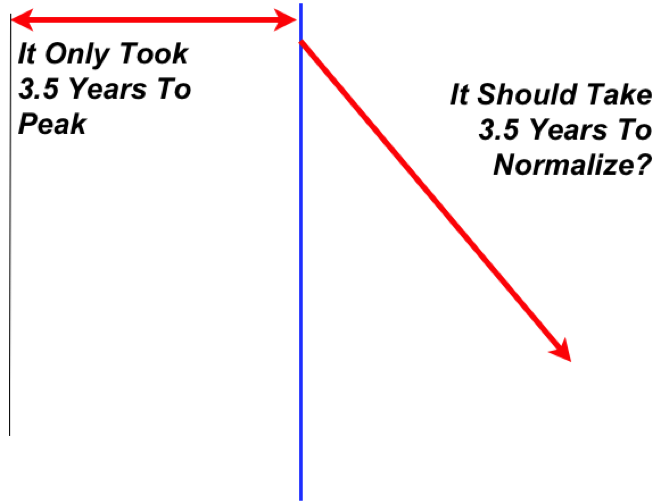
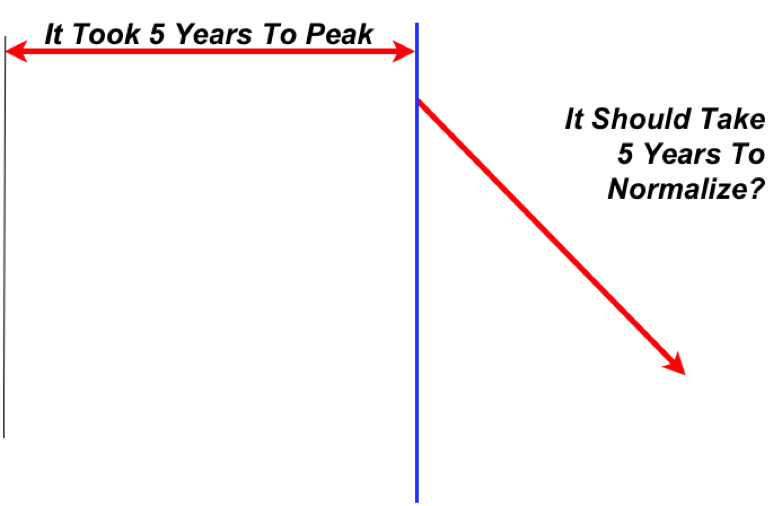
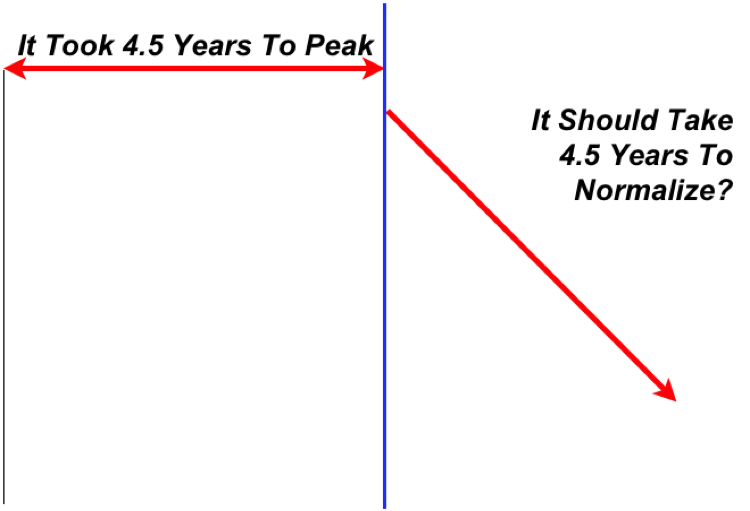
I started tracking foreclosures in late 2002 when I could get them digitally. These three charts are fairly representative of the level of activity in all the metro counties - i.e. all the metro county charts would look about the same. Well, what happened here? First, you see that, at first, there were 400-700 foreclosures per month just because life happens. This continued until late 2005 where it started to rise to where it peaked in late 2010. OK, like most things, it will probably be a "bell curve" type of chart. This means that if it took 5 years to run up and peak out and it will probably take 5 years to come back down to normal. That would be late 2015 and that seems generous. Although Roswell was hit later and appears to be recovering quicker. Overall, that coincides with the Shiller forecast. However, government “fiddling” with the market always scares me. Now, in late 2014, it appears that we are back to about normal foreclosures.
What’s the “take-a-way” from all this? Let's start with a couple of basic premises. (1) Foreclosures hurt all of us - in every market. (2) Every time a foreclosure hits around you, then the value of your home drops another notch. (3) And... we are not done with foreclosures. (4) The value of your home is probably going to continue to drop into 2014 slightly as we get “back to normal.”
In Roswell - in June 2007 - there were 31 foreclosure notices - In October 2014 there are 19 which illustrates that all real estate is local. Roswell is fairing better - so far - than the average Fulton or Gwinnett County resident.
Foreclosure Charts